We have all heard about the new movement “MAHA” which stands for “Make America Healthy Again.”
That’s a great goal, but when were we ever healthy?
“Again,” as in when?
Well, that’s hard to say because there are so many health issues and diseases we could connect the “health” metric to, but since obesity tends to be linked to most of them, I chose that one.
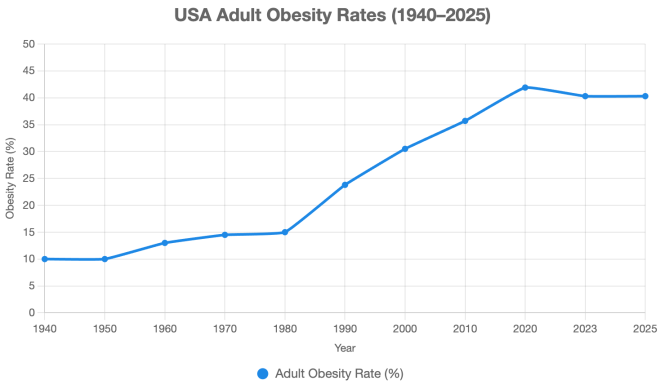
Here’s the chart showing how fat our country has become, and back when we weren’t fat, which was around the time of World War II. So, in other words, MAHA is trying to get us back to the 1940’s.
Yes, it’s been that long.

One in 10 people was obese in the 1940’s. After WWII, as the economy boomed, people began to indulge more, leading to an increase in calorie consumption, especially of carbohydrates. That’s when this attitude and habit started to snowball.
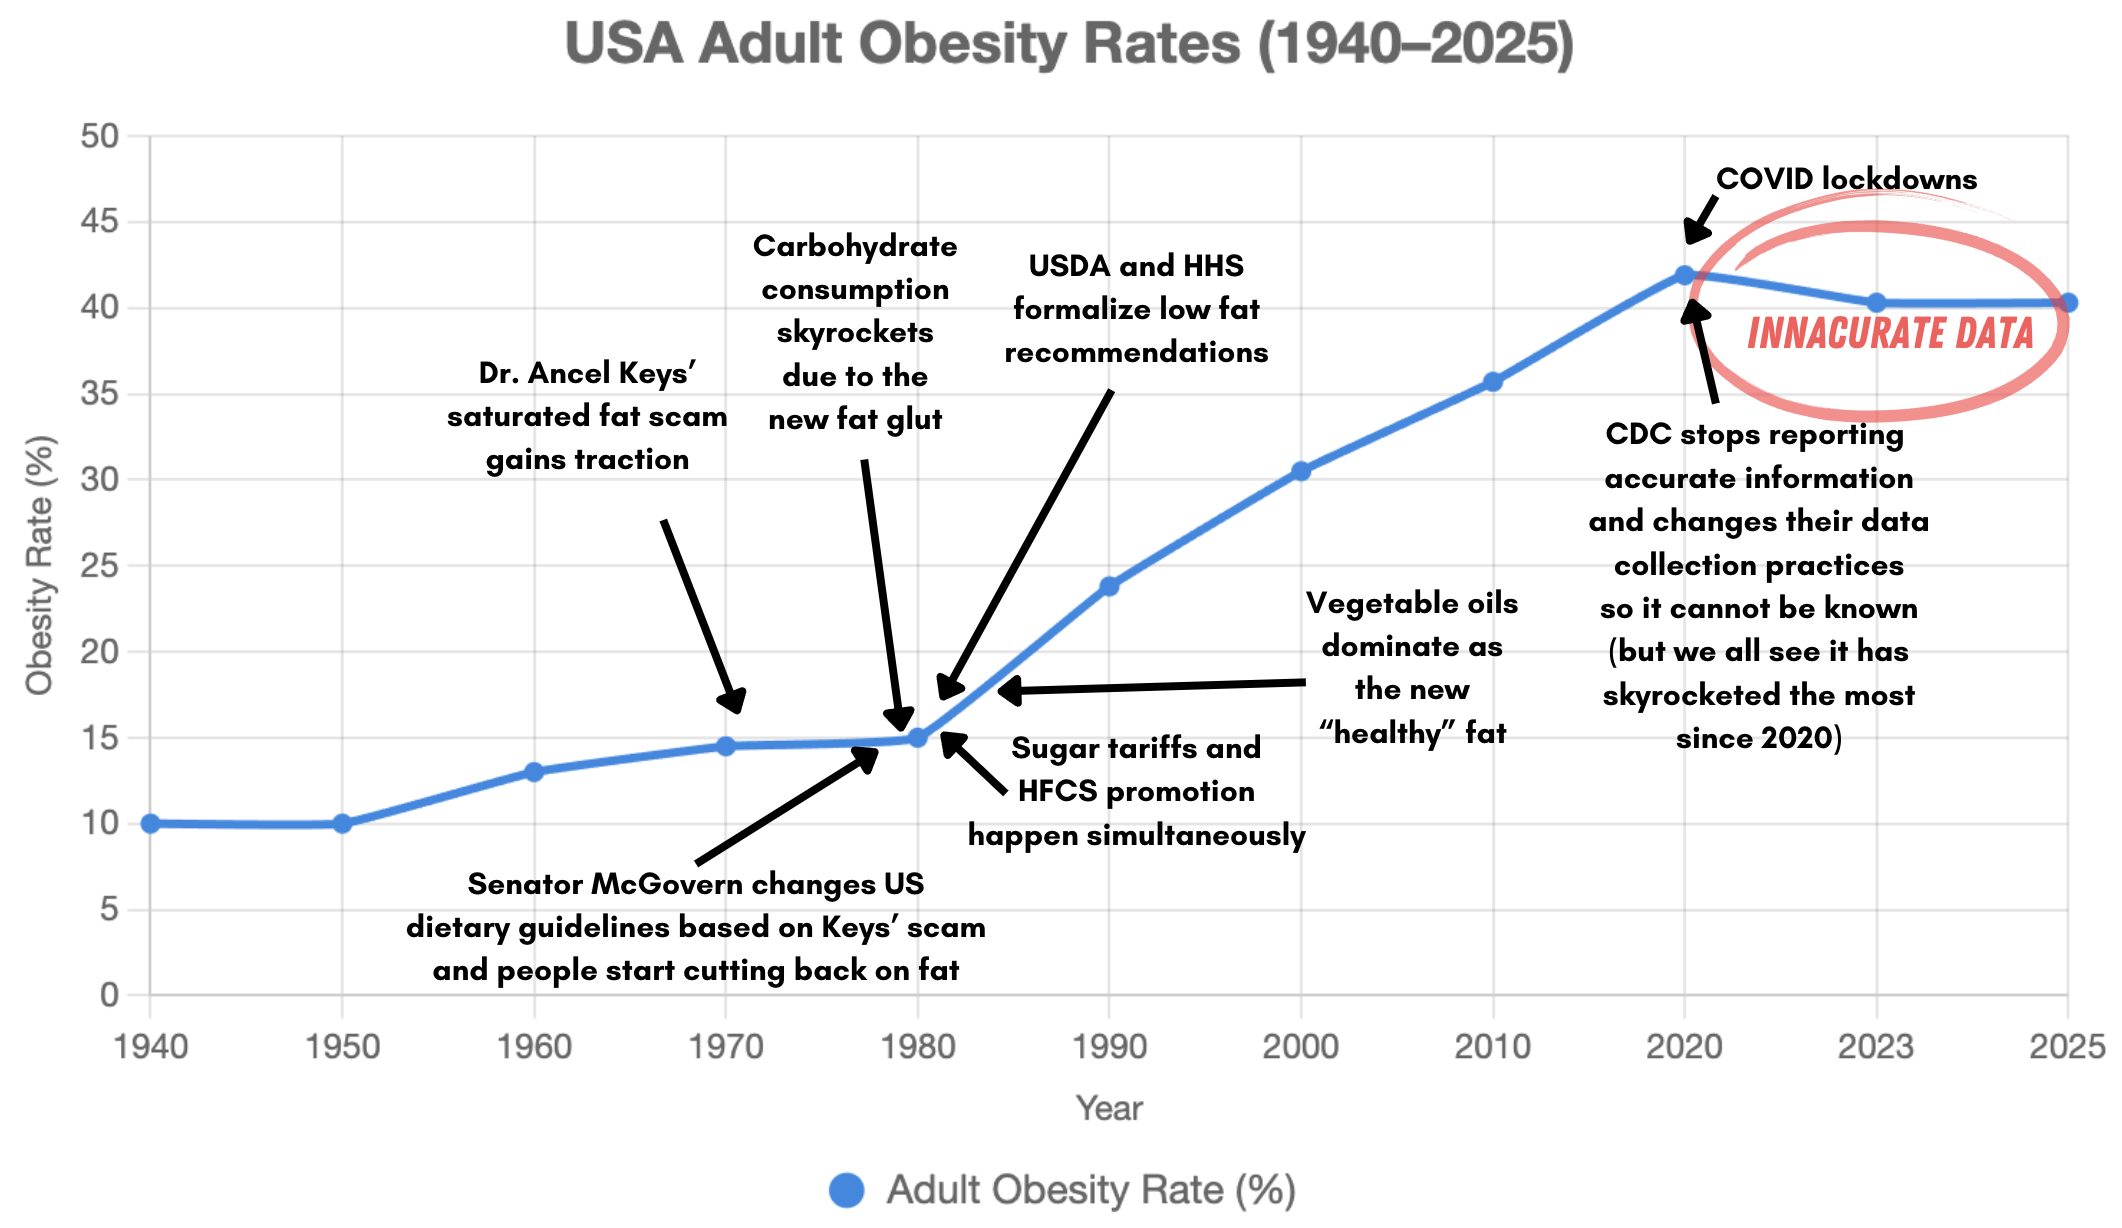
Then in the late 70’s, all heck broke loose. Dr. Ancel Keys cherry-picked a handful of countries trying to show that saturated fat caused heart disease. Senator McGovern’s dietary guidelines committee changed the US recommendations based on Dr. Keys’ scam. This led people to shift away from animal fats and toward vegetable oils and trans fats, such as margarine.
Then, around 1980, the USDA and the HHS formalized low-saturated-fat recommendations, which somehow also turned into overall low-fat intake, resulting in the start of the low-fat revolution, which is still largely effective today.
Obesity skyrocketed faster than ever during the lockdowns of 2020, which (probably not coincidentally) was also the year the CDC changed its data collection and reporting system so accurate numbers were no longer gathered or made publicly available.
Being in the health and fitness industry since 1987, I can easily see trends and notice changes in the population, so the spike in obesity since 2020 is undeniable. I’m sure you can see it too. In fact, “chubby” is the new normal now.
Hopefully, we will be able to gather accurate information since 2020, but I’m not getting my hopes up. Below is the same chart as above, with the events mentioned here, including their dates.
Things that make me go “Hmmm…”

Sources:
- https://www.cdc.gov/nchs/nhanes/index.htm
- https://www.cdc.gov/mmwr/volumes/73/wr/mm7336a1.htm
- https://www.niddk.nih.gov/health-information/health-statistics/overweight-obesity
- https://www.cdc.gov/nchs/data/hestat/obesity-adult-17-18/obesity-adult.htm
- https://www.sevencountriesstudy.com/
- https://www.govinfo.gov/content/pkg/CHRG-110hhrg40624/pdf/CHRG-110hhrg40624.pdf
- https://www.dietaryguidelines.gov/about-dietary-guidelines/previous-editions
- https://www.heart.org/en/about-us/history-of-the-american-heart-association
- https://www.ers.usda.gov/data-products/food-availability-per-capita-data-system/
- https://www.cdc.gov/museum/timeline/covid19.html
- https://www.who.int/emergencies/diseases/novel-coronavirus-2019/situation-reports
These sources were cross-referenced for accuracy.
Remonder: The 2020–2025 value is an assumption based on the 2021–2023 “plateau,” as no newer data was found BECAUSE THE CDC STOPPED REPORTING VALID NUMBERS.


